
How Long Does It Take to Run a Mile? Times by Age and Pace
Raceblock team November 16, 2026 10 min read
Free training plan for your race date
Free training plan for your race date
Build my free planIn this article
Most people take 9 to 13 minutes to run a mile (1.61 km) at an easy, conversational pace, and 6 to 8 minutes when they race it flat out. A 10 minute mile is 6:13 /km, a 12 minute mile is 7:27 /km, and both are completely normal.
The catch is that "how long" has two honest answers for the same person. An easy mile and an all-out mile are often 3 to 4 minutes apart, so the first thing to decide is which one you mean.
How long does it take to run a mile?
At your normal easy pace, the answer is whatever your watch shows per mile on an everyday run. For most people who jog a few times a week that is somewhere between 9 and 13 minutes. Race the same mile on a track and the time usually drops by several minutes.
Here is what each mile time means as a pace, and what the same pace adds up to over 2 miles (3.2 km) and 5 miles (8 km):
| Mile time | Pace per km | Pace per mile | 5 miles (8 km) at that pace |
|---|---|---|---|
| 6:00 | 3:44 /km | 6:00 /mi | 30:00 |
| 7:00 | 4:21 /km | 7:00 /mi | 35:00 |
| 8:00 | 4:58 /km | 8:00 /mi | 40:00 |
| 9:00 | 5:36 /km | 9:00 /mi | 45:00 |
| 10:00 | 6:13 /km | 10:00 /mi | 50:00 |
| 11:00 | 6:50 /km | 11:00 /mi | 55:00 |
| 12:00 | 7:27 /km | 12:00 /mi | 60:00 |
| 13:00 | 8:05 /km | 13:00 /mi | 65:00 |
| 15:00 | 9:19 /km | 15:00 /mi | 75:00 |
| 20:00 | 12:26 /km | 20:00 /mi | 100:00 |
The rows are arithmetic, not a forecast. You will not hold your one-mile race pace for 5 miles (8 km). The 5 mile column assumes an even pace, which fits easy running, not racing. To convert any other pace, the running pace conversion chart goes both ways between km and miles.
Easy mile or raced mile: the gap most charts hide
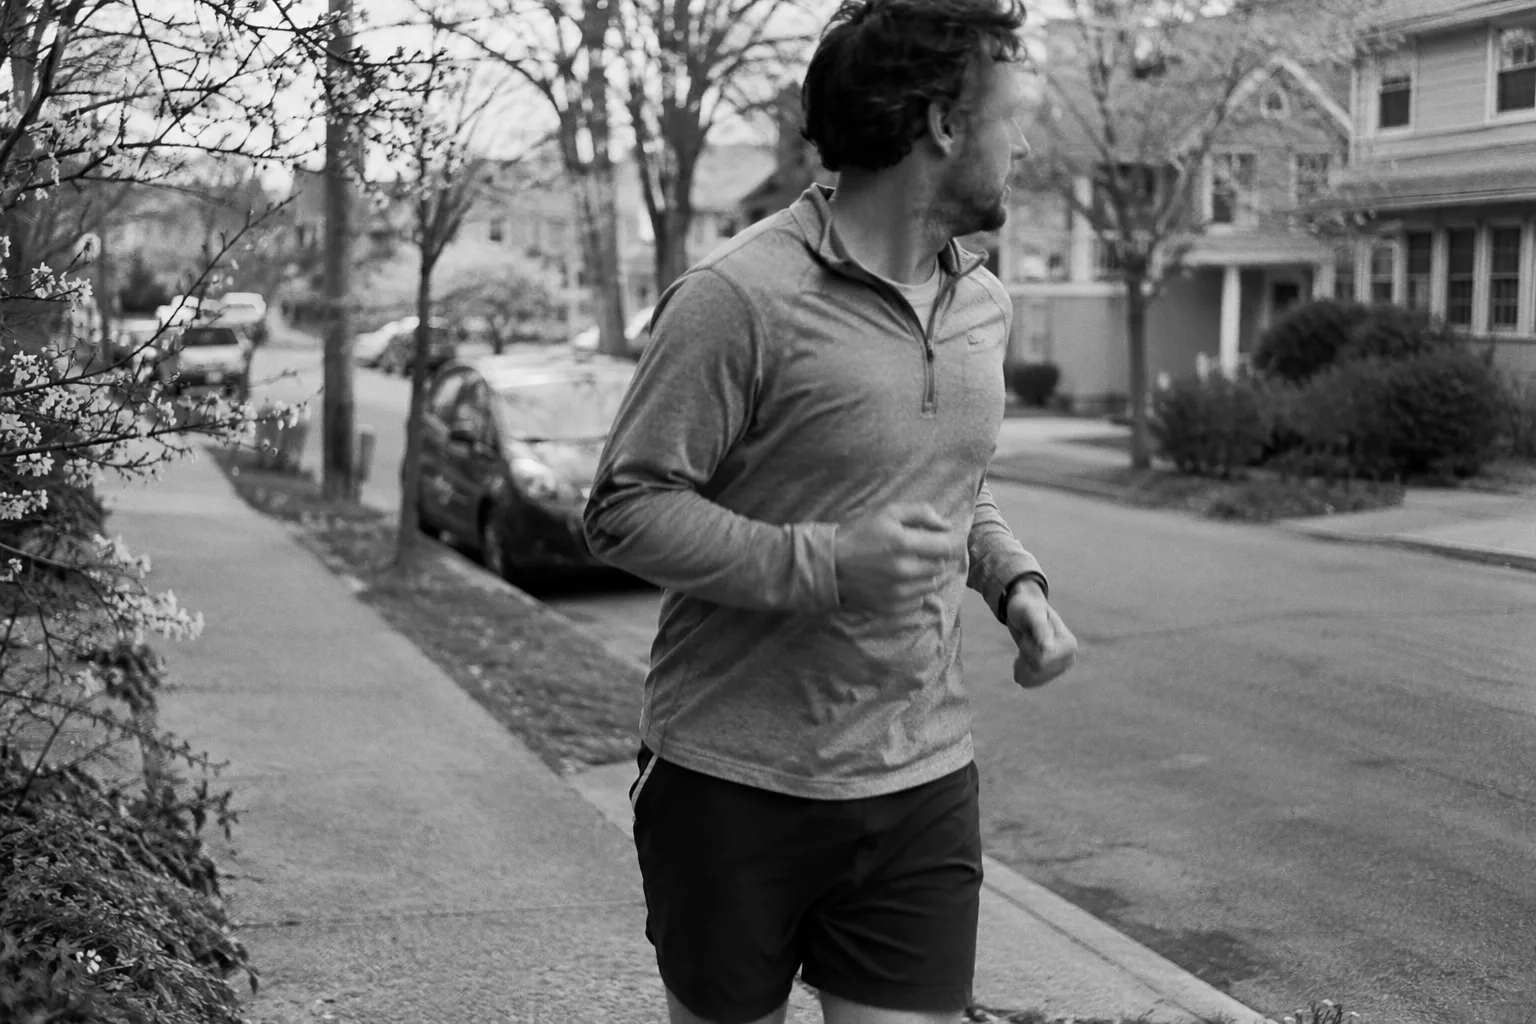
This is the part that confuses people. Most "average mile time" figures you see online come from runners who sat down and timed a hard mile. Most people asking how long a mile takes are thinking of jogging one. Those are different numbers.
| What you are doing | Typical mile time | Pace per km |
|---|---|---|
| Brisk walk | 15:00 to 20:00 | 9:19 to 12:26 /km |
| Walk-run, new runner | 13:00 to 15:00 | 8:05 to 9:19 /km |
| Easy jog, regular runner | 9:00 to 13:00 | 5:36 to 8:05 /km |
| Hard effort, intermediate adult | about 6:00 to 7:30 | about 3:44 to 4:40 /km |
| Elite | under 4:30 | under 2:48 /km |
So if your easy mile is 11:30 and a chart says the average is 6:03, you are not slow. You are comparing a jog with a race. The fair test is to time one hard mile on a track and compare that with the age tables below. Your easy pace should stay easy. Our guide to pace when running explains how far apart easy, steady and hard paces should sit.
Average mile run time by age
The tables below are the intermediate standard from Running Level's 1 mile times, built from 8,036 qualifying results its users logged from 2020 to 2026. Intermediate means faster than half of those runners, so it describes a runner who times a hard mile, not everyone who jogs one.
The 2 mile column is an estimate using Riegel's formula (time x 2^1.06, so about 2.08 x your mile time), a standard way to scale race times. Treat it as a ballpark.
Men, intermediate standard
| Age | Mile time | Pace per km | Estimated 2 miles (3.2 km) |
|---|---|---|---|
| 15 | 6:24 | 3:59 /km | about 13:21 |
| 20 | 6:03 | 3:46 /km | about 12:37 |
| 30 | 6:03 | 3:46 /km | about 12:37 |
| 40 | 6:29 | 4:02 /km | about 13:31 |
| 50 | 6:58 | 4:20 /km | about 14:32 |
| 60 | 7:33 | 4:41 /km | about 15:44 |
| 70 | 8:30 | 5:17 /km | about 17:43 |
Women, intermediate standard
| Age | Mile time | Pace per km | Estimated 2 miles (3.2 km) |
|---|---|---|---|
| 15 | 7:48 | 4:51 /km | about 16:16 |
| 20 | 7:15 | 4:30 /km | about 15:07 |
| 30 | 7:24 | 4:36 /km | about 15:26 |
| 40 | 7:57 | 4:56 /km | about 16:35 |
| 50 | 8:35 | 5:20 /km | about 17:54 |
| 60 | 9:15 | 5:45 /km | about 19:17 |
| 70 | 10:14 | 6:22 /km | about 21:20 |
Read it as a curve. From 20 to 40 the men's standard moves by 26 seconds. From 40 to 60 it moves by 1:04. For most adults under 50, training changes your mile time far more than your birthday does.
Average mile time for a 14 or 15 year old
Running Level's table jumps from age 10 to age 15, so the age 15 row is the closest guide for a 14 year old. At 15 the intermediate standard is 6:24 for boys and 7:48 for girls, with beginners at 9:09 and 11:08. Teens improve fast from year to year, so a time a minute off these numbers at 14 is common.
How fast should a 60 year old run a mile?
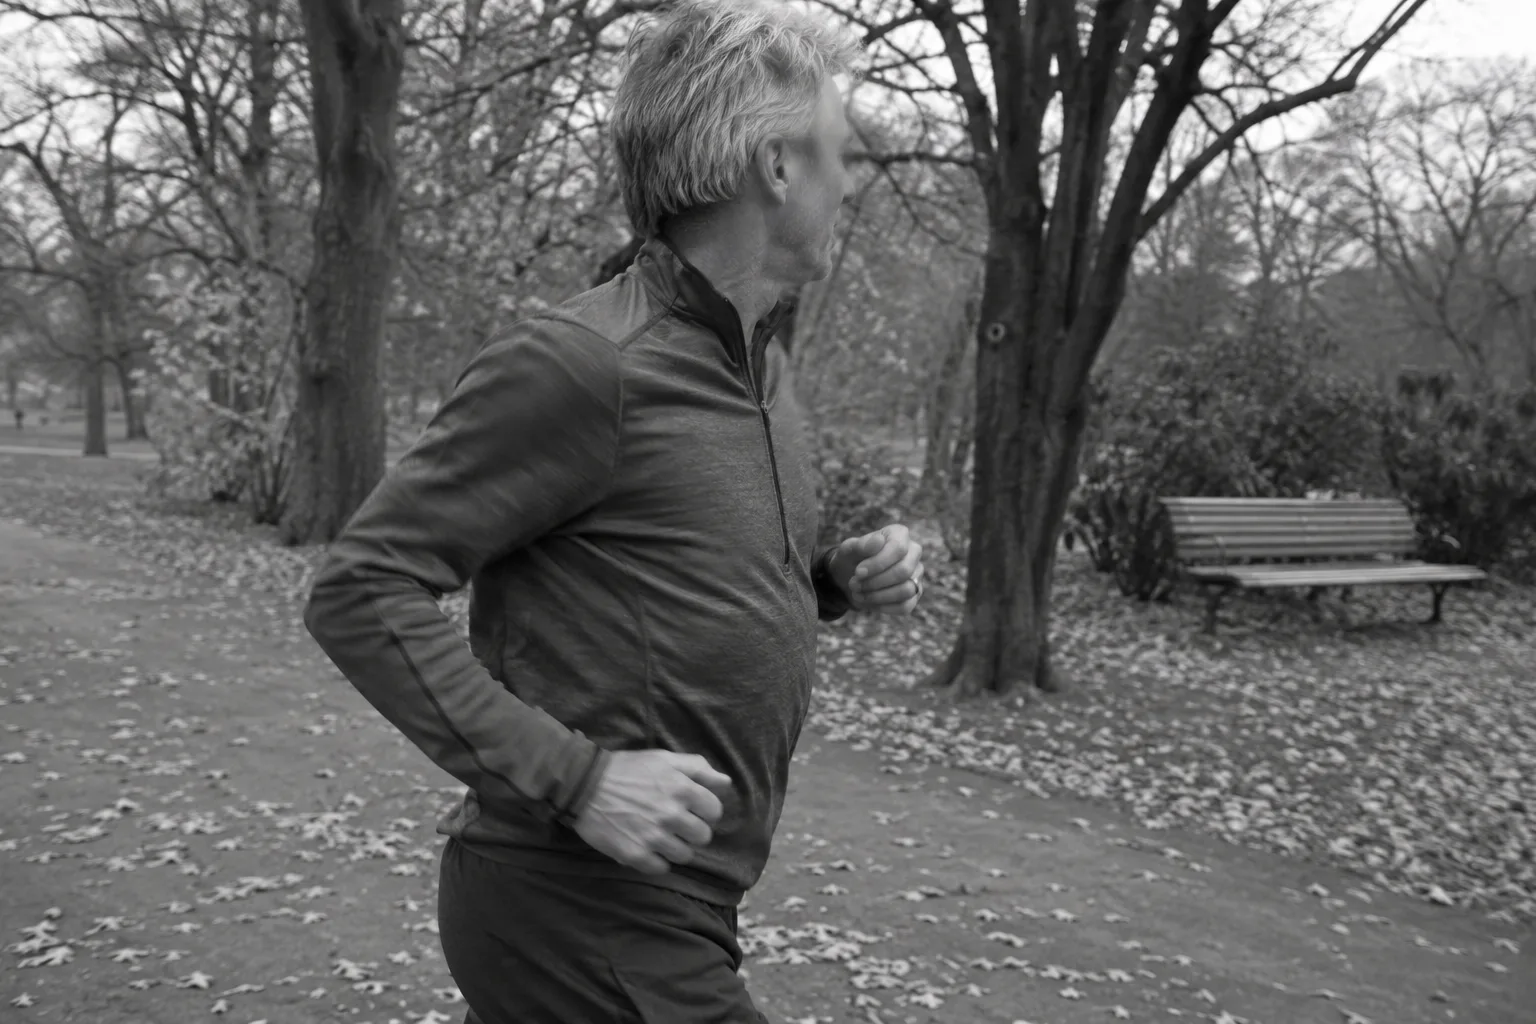
At 60, Running Level's intermediate standard is 7:33 for men and 9:15 for women, with beginner standards of 10:47 and 13:13. For an easy mile, any pace that lets you talk in full sentences is the right one, whether that is 11 minutes or 15.
Is a 12 minute mile good for a beginner?
Yes. A 12 minute mile is 7:27 /km, a normal pace for a new runner and for plenty of experienced runners on easy days. If you can run a whole mile without stopping at any pace, you have passed the hardest stage. Speed comes later and mostly from running more often.
If you need walk breaks, that is fine too. Many beginners start with 1 minute of running and 1 to 2 minutes of walking, and a run-walk mile of 13 to 15 minutes is a common starting point. Our guide on how to run longer without getting tired shows how to stretch those running minutes week by week.

Is a 4 minute mile good?
A 4 minute mile is elite. It is 2:29 /km held for the full 1.61 km, and Running Level puts its elite men's standard at 4:42, meaning faster than 95% of the men who log results. The mile run was first run under 4 minutes by Roger Bannister in 1954, and the women's world record is 4:07.64 by Faith Kipyegon in 2023. For a recreational runner, a sub 6 minute mile is a strong goal and sub 7 a very respectable one.
How to run a faster mile
You do not need a special mile plan. Three changes do most of the work:
- Run more often at an easy pace. Going from two runs a week to three or four builds the aerobic base that a mile still depends on.
- Add one faster session a week. Short repeats such as 6 x 400 m (0.25 mi) at your hard mile pace with 2 minutes of walking between them. The interval training plan guide has more sessions, and fartlek running is a looser way to start.
- Warm up before you time it. Ten minutes of easy jogging and four short pickups. A cold first lap is the most common reason a mile test disappoints. See how to warm up before running.
Retest every four to six weeks, on the same track, and run the first lap a little slower than you think you should. The last lap is where a mile is won.
General training guidance, not medical advice. Check with a doctor before increasing training if you have symptoms or a health condition.

Mistakes that make a mile feel harder
- Comparing your jog with someone's race. An 11 minute easy mile and a 7 minute raced mile can belong to the same person.
- Sprinting the first lap. Going out 10 seconds too fast over the first 400 m (0.25 mi) usually costs more than that in the last 400 m.
- Timing it on GPS alone. Watches often read a little long or short. A 400 m track gives you a true mile in four laps (1,600 m is 9 m short of a mile).
- Running every run hard. Easy days are what let the hard mile get faster.
- Ignoring pain. Chest pain, dizziness or sharp pain is a reason to stop and see a doctor, not to finish the lap.
When a mile turns into a race goal
For many runners, the first timed mile is the start of a bigger plan: a 5K, a 10k, then a half marathon. You can see where your mile points with the race time predictor, and the average 5K time by age uses the same Running Level standards for the next distance up.
You can build those weeks yourself with a paper schedule. The wall is specific: the plan doesn't move when your week does. A sick week, a work trip or a missed long run leaves you guessing how to rebuild, while the race date gets closer. Build your free plan for your race date. On the Coach plan, next week re-plans itself when you miss a run.
Free training plan
Build your free plan for your race date.
Pick your race and race date. Every week from today to race day is planned for you, with distances in km and miles.
A mile is 1.61 km, and running one takes most people 9 to 13 minutes at an easy pace and 6 to 8 minutes at race effort. Decide which mile you are timing, compare a raced mile with your age row, and let your easy miles stay easy.
When your mile becomes a half marathon goal and you want the weeks built around your race date, build your free plan. On the Coach plan, next week re-plans itself when you miss a run.
Frequently asked questions
There is no single right time. At an easy pace most recreational runners take 9 to 13 minutes. At race effort, Running Level's intermediate adult standard is 6:03 for men and 7:15 for women.
Yes. It is 7:27 /km, a normal beginner pace and a common easy pace for experienced runners. Running a full mile without stopping matters more than the time.
It is elite. A 4 minute mile is 2:29 /km and is faster than Running Level's elite men's standard of 4:42. For recreational runners, sub 6 or sub 7 minutes is a strong goal.
Running Level's intermediate standard at 60 is 7:33 for men and 9:15 for women, and the beginner standard is 10:47 and 13:13. On easy runs, any pace you can talk at is right.
Running Level's closest row is age 15: an intermediate standard of 6:24 for boys and 7:48 for girls, and 9:09 and 11:08 at beginner level. Teens often improve by a lot within a year.
Run three or four easy runs a week, add one session of short repeats such as 6 x 400 m (0.25 mi), warm up for ten minutes before a timed mile, and start the first lap slightly slower than goal pace.
Multiply your easy mile time by five. At a 10 minute mile (6:13 /km) that is 50 minutes for 5 miles (8 km). At a 12 minute mile (7:27 /km) it is 60 minutes.
At a brisk walk, about 15 to 20 minutes, which is 9:19 to 12:26 /km.
Free training plan
Build your free plan for your race date.
On the Coach plan, next week re-plans itself when you miss a run.
Share article
About the author
More running training guides
Pacing and race day · 11 min
10K Running Pace Chart: Every Time From 35 to 75 Minutes
A 10K running pace chart for every finish time from 35:00 to 1:15:00: pace per km and per mile, 5 km halfway splits, 400 m laps, treadmill speeds, and what your 10K says about a half or marathon.
Pacing and race day · 9 min
How Long to Run a 10K: Finish Times, Miles and Training
A 10k run is 10 km (6.21 mi) and takes about 60 minutes at 6:00 /km (9:39 /mi). See finish times at every pace, how long to train for one and how to pace your first race.
Pacing and race day · 10 min
5K Running Pace Chart: Every Time From 15 to 45 Minutes
A 5K running pace chart for every finish time from 15:00 to 45:00: pace per km and per mile, 400 m lap times, treadmill speeds, and what your 5K says about a half or marathon.
Pacing and race day · 10 min
Average 5K Time by Age for Men and Women (20 to 80)
The average 5K time by age is about 22:41 for men and 27:19 for women in their 20s, slowing by about a minute every five years after 35. Here are the age tables, the race field median of 34:37, and how to find your own time.

Pacing and race day · 10 min
Running Pace Conversion Chart: Km, Mile and Treadmill
Convert any running pace between minutes per km and minutes per mile, and treadmill mph or km/h into pace, with marathon and half marathon finish times in the same charts.
Pacing and race day · 11 min
What Is a Negative Split in Running? Splits for Every Goal
A negative split means you run the second half of a race faster than the first. You earn it by starting 5 to 10 seconds per km slower than goal pace, not by sprinting the end. Here is how big it should be for each race distance, the marathon halves for common goals, and the two sessions that train it.