
10K Running Pace Chart: Every Time From 35 to 75 Minutes
Raceblock team November 16, 2026 11 min read
Free training plan for your race date
Free training plan for your race date
Build my free planIn this article
A 10K running pace chart turns a finish time for 10 km (6.2 mi) into the pace you need to hold, per kilometer and per mile. The quick version: divide your goal time by 10 for pace per km, so a 50:00 10K is 5:00 /km (8:03 /mi) and a 1:00:00 10K is 6:00 /km (9:39 /mi).
The chart below covers every whole minute from 35:00 to 1:15:00, with the 5 km (3.1 mi) halfway split, 400 m (0.25 mi) laps and treadmill speeds. The part most runners miss: in a 10K, just 6 seconds per km is a full minute at the finish, and the honest test of your pacing is not the first kilometer but the halfway clock.
10K running pace chart: 35:00 to 1:15:00
Find your goal finish time in the left column and read across. Pace per km and per mile are the even pace for the whole 10 km (6.2 mi). The halfway column is your clock at 5 km (3.1 mi) on an even-paced race, the 400 m lap is one lap of a standard outdoor track, and the speed columns are what to set on a treadmill.
| 10K finish | Pace per km | Pace per mile | 5 km halfway | 400 m lap | Speed (km/h) | Speed (mph) |
|---|---|---|---|---|---|---|
| 35:00 | 3:30 /km | 5:38 /mi | 17:30 | 1:24 | 17.1 | 10.7 |
| 36:00 | 3:36 /km | 5:48 /mi | 18:00 | 1:26 | 16.7 | 10.4 |
| 37:00 | 3:42 /km | 5:57 /mi | 18:30 | 1:29 | 16.2 | 10.1 |
| 38:00 | 3:48 /km | 6:07 /mi | 19:00 | 1:31 | 15.8 | 9.8 |
| 39:00 | 3:54 /km | 6:17 /mi | 19:30 | 1:34 | 15.4 | 9.6 |
| 40:00 | 4:00 /km | 6:26 /mi | 20:00 | 1:36 | 15.0 | 9.3 |
| 41:00 | 4:06 /km | 6:36 /mi | 20:30 | 1:38 | 14.6 | 9.1 |
| 42:00 | 4:12 /km | 6:46 /mi | 21:00 | 1:41 | 14.3 | 8.9 |
| 43:00 | 4:18 /km | 6:55 /mi | 21:30 | 1:43 | 14.0 | 8.7 |
| 44:00 | 4:24 /km | 7:05 /mi | 22:00 | 1:46 | 13.6 | 8.5 |
| 45:00 | 4:30 /km | 7:15 /mi | 22:30 | 1:48 | 13.3 | 8.3 |
| 46:00 | 4:36 /km | 7:24 /mi | 23:00 | 1:50 | 13.0 | 8.1 |
| 47:00 | 4:42 /km | 7:34 /mi | 23:30 | 1:53 | 12.8 | 7.9 |
| 48:00 | 4:48 /km | 7:43 /mi | 24:00 | 1:55 | 12.5 | 7.8 |
| 49:00 | 4:54 /km | 7:53 /mi | 24:30 | 1:58 | 12.2 | 7.6 |
| 50:00 | 5:00 /km | 8:03 /mi | 25:00 | 2:00 | 12.0 | 7.5 |
| 51:00 | 5:06 /km | 8:12 /mi | 25:30 | 2:02 | 11.8 | 7.3 |
| 52:00 | 5:12 /km | 8:22 /mi | 26:00 | 2:05 | 11.5 | 7.2 |
| 53:00 | 5:18 /km | 8:32 /mi | 26:30 | 2:07 | 11.3 | 7.0 |
| 54:00 | 5:24 /km | 8:41 /mi | 27:00 | 2:10 | 11.1 | 6.9 |
| 55:00 | 5:30 /km | 8:51 /mi | 27:30 | 2:12 | 10.9 | 6.8 |
| 56:00 | 5:36 /km | 9:01 /mi | 28:00 | 2:14 | 10.7 | 6.7 |
| 57:00 | 5:42 /km | 9:10 /mi | 28:30 | 2:17 | 10.5 | 6.5 |
| 58:00 | 5:48 /km | 9:20 /mi | 29:00 | 2:19 | 10.3 | 6.4 |
| 59:00 | 5:54 /km | 9:30 /mi | 29:30 | 2:22 | 10.2 | 6.3 |
| 1:00:00 | 6:00 /km | 9:39 /mi | 30:00 | 2:24 | 10.0 | 6.2 |
| 1:01:00 | 6:06 /km | 9:49 /mi | 30:30 | 2:26 | 9.8 | 6.1 |
| 1:02:00 | 6:12 /km | 9:59 /mi | 31:00 | 2:29 | 9.7 | 6.0 |
| 1:03:00 | 6:18 /km | 10:08 /mi | 31:30 | 2:31 | 9.5 | 5.9 |
| 1:04:00 | 6:24 /km | 10:18 /mi | 32:00 | 2:34 | 9.4 | 5.8 |
| 1:05:00 | 6:30 /km | 10:28 /mi | 32:30 | 2:36 | 9.2 | 5.7 |
| 1:06:00 | 6:36 /km | 10:37 /mi | 33:00 | 2:38 | 9.1 | 5.6 |
| 1:07:00 | 6:42 /km | 10:47 /mi | 33:30 | 2:41 | 9.0 | 5.6 |
| 1:08:00 | 6:48 /km | 10:57 /mi | 34:00 | 2:43 | 8.8 | 5.5 |
| 1:09:00 | 6:54 /km | 11:06 /mi | 34:30 | 2:46 | 8.7 | 5.4 |
| 1:10:00 | 7:00 /km | 11:16 /mi | 35:00 | 2:48 | 8.6 | 5.3 |
| 1:11:00 | 7:06 /km | 11:26 /mi | 35:30 | 2:50 | 8.5 | 5.3 |
| 1:12:00 | 7:12 /km | 11:35 /mi | 36:00 | 2:53 | 8.3 | 5.2 |
| 1:13:00 | 7:18 /km | 11:45 /mi | 36:30 | 2:55 | 8.2 | 5.1 |
| 1:14:00 | 7:24 /km | 11:55 /mi | 37:00 | 2:58 | 8.1 | 5.0 |
| 1:15:00 | 7:30 /km | 12:04 /mi | 37:30 | 3:00 | 8.0 | 5.0 |

Every number is computed, not estimated: 10 km divided into equal parts, and an international mile is exactly 1.609344 km (NIST). Times are rounded to the nearest second. If your race is shorter, the 5K running pace chart has the same columns for 15:00 to 45:00.
Why 6 seconds per km is one minute
A 10K has ten kilometers, so whatever you gain or lose per kilometer, you gain or lose ten times. 6 seconds x 10 is 60 seconds. That is why the rows in the chart sit 6 seconds per km (about 10 seconds per mile) apart.
This is the opposite of what the distance feels like. A 5K is short enough that a sloppy kilometer costs you little; a marathon pace chart is so long that runners naturally start slow. The 10K sits in between: long enough for a fast start to hurt, short enough that it feels safe to go out hard. Going from 55:00 to 50:00 asks for 5:30 /km down to 5:00 /km, 30 seconds faster on every kilometer. Pick a goal one or two rows faster than your recent result, not five.
Split times for popular 10K goals
The big chart gives you pace. On race day it is easier to check the clock at a few fixed points. These are even-pace splits for the goals most runners aim for.
| 10K goal | 1 km (0.6 mi) | 2 km (1.2 mi) | 5 km (3.1 mi) | 8 km (5 mi) |
|---|---|---|---|---|
| 40:00 | 4:00 | 8:00 | 20:00 | 32:00 |
| 45:00 | 4:30 | 9:00 | 22:30 | 36:00 |
| 50:00 | 5:00 | 10:00 | 25:00 | 40:00 |
| 55:00 | 5:30 | 11:00 | 27:30 | 44:00 |
| 1:00:00 | 6:00 | 12:00 | 30:00 | 48:00 |
| 1:05:00 | 6:30 | 13:00 | 32:30 | 52:00 |
| 1:10:00 | 7:00 | 14:00 | 35:00 | 56:00 |
Most 10K courses mark every kilometer or every mile. Pick two checkpoints, write them on your hand or set them as your watch's lap alert, and ignore the rest. The 5 km clock matters most: it tells you whether the second half is still yours to run.
How to pace a 10K with the chart
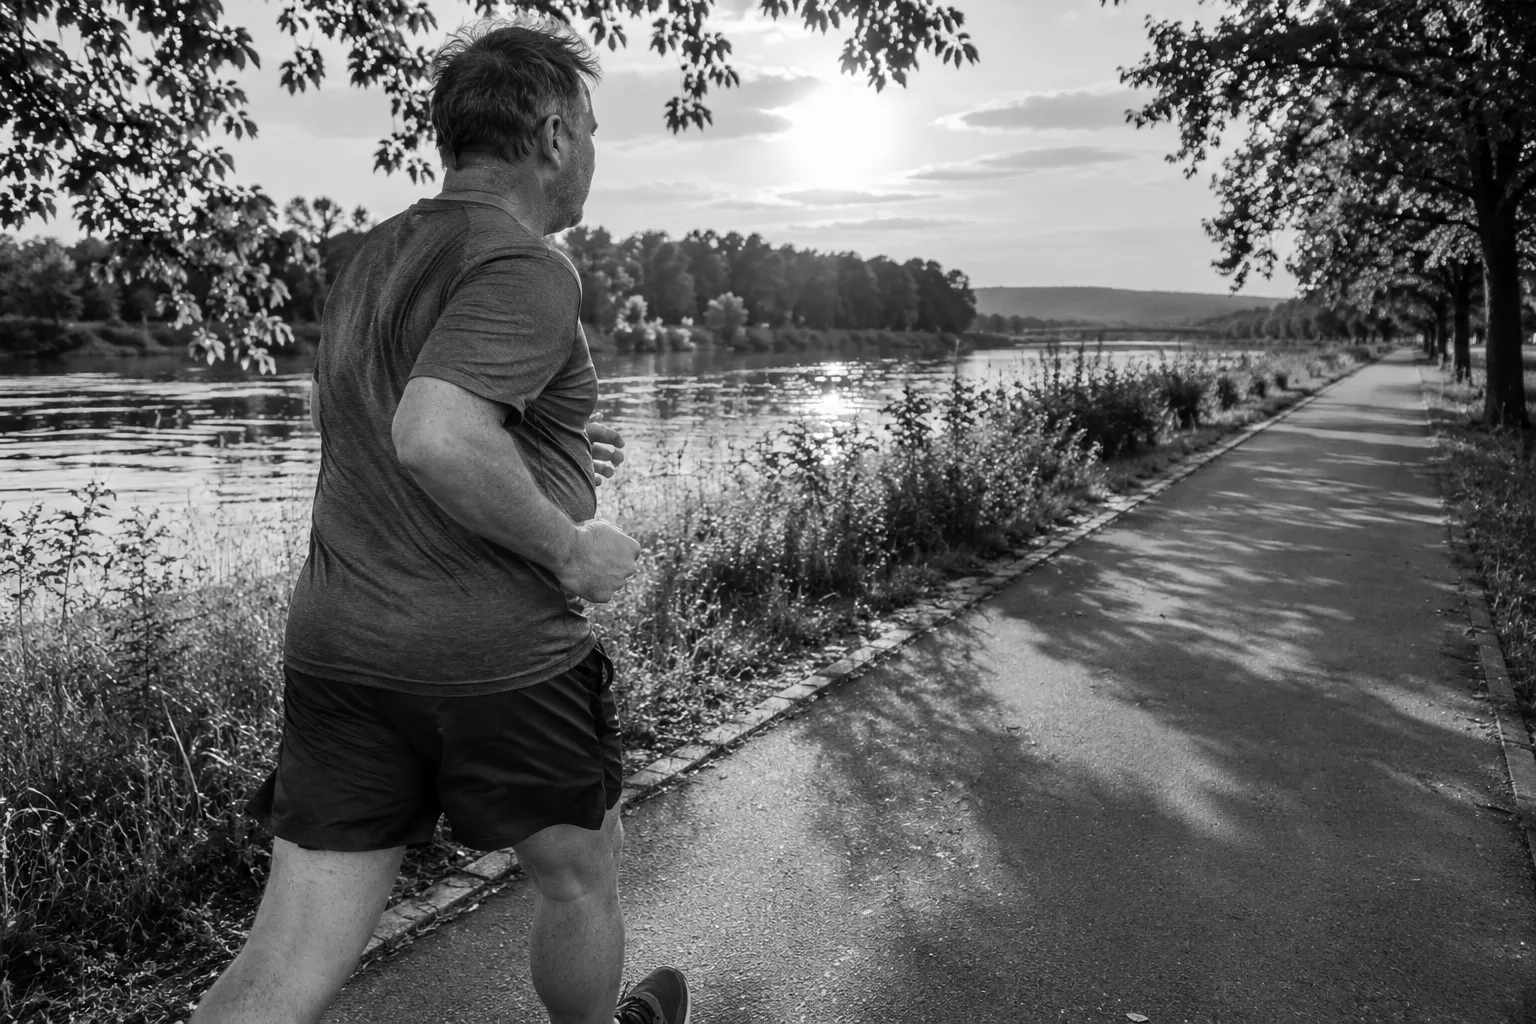
Run the first 2 km (1.2 mi) on your number even when it feels slow, hold it to halfway, and only race from about 8 km (5 mi).
How to pace a 10K with a pace chart
- Pick one row
Use a 10K you ran recently, or one row faster. If you have only raced a 5K, use the conversion in the table further down rather than a guess.
- Write down three numbers
Your pace per km, your pace per mile and your 5 km split. A 55:00 goal is 5:30 /km, 8:51 /mi and 27:30 at halfway.
- Run the first 2 km on the number
A crowd and fresh legs make any pace feel easy for the first ten minutes. Check your 1 km and 2 km splits and slow down if you are more than a few seconds ahead.
- Check the clock at 5 km
On target or a few seconds slow is fine. Well ahead of target means the second half will cost you more than you banked.
- Hold from 5 km to 8 km
This is the hard part of a 10K. The pace that felt easy now feels hard, and that is normal. Keep the same number.
- Race the last 2 km
If you still have something at 8 km (5 mi), speed up gradually. Finishing faster than you started is a negative split.
What a fast start actually costs
Take a runner aiming for 50:00 (5:00 /km, 8:03 /mi) who runs the first 2 km at 4:45 /km because everyone around them is. They are 30 seconds ahead at 2 km. If they then fade to 5:10 /km for the last 8 km, they finish in 50:50: 50 seconds slower than the even plan. The fade does not need to be dramatic. 10 seconds per km over 8 km is 80 seconds, and it wipes out the 30 seconds banked early.
Which column to use: pick your situation
Different runners need different parts of the chart. This table matches the situation to the column.
| Your situation | Use this column | Watch out for |
|---|---|---|
| First 10K or a local road race | Pace per km or per mile, plus the 5 km split | Starting faster than the row you picked |
| 10K on a track | 400 m lap | 25 laps is a lot to count; use your watch's lap counter |
| Treadmill 10K | Speed (km/h) or (mph) | Belt calibration varies between machines |
| Hilly course | 5 km split, not pace per km | Chasing pace on the climbs |
| 10K inside a half or marathon block | Pace per km, then the race equivalents below | One race is one day; look at the trend |
Your first 10K or a local road race
Use a pace you can hold in training for a long run of 8 to 10 km (5 to 6.2 mi), plus a little race-day lift, not a time you hope for. Most first 10Ks go wrong in the first 2 km. If you want to know where a finish time sits, how long it takes to run a 10K covers typical finish times and how long training takes.

A 10K on the track
A 10K is 25 laps of a 400 m (0.25 mi) track. The lap column does the work: a 45:00 goal is 1:48 per lap, a 50:00 goal is 2:00, and a 1:00:00 goal is 2:24. Lap times are steadier than a GPS reading, which jumps around on the bends.
A treadmill 10K
Set the speed from the chart and leave it. 10.0 km/h (6.2 mph) is a 1:00:00 10K and 12.0 km/h (7.5 mph) is 50:00. Treadmills are calibrated differently, so a treadmill time is a guide, not a result to compare with a road race.
A hilly course
Pace per km stops meaning much on a climb. Run the hills by effort, let the pace drop going up, and get it back on the way down. Then judge yourself on the 5 km clock and the finish, not on any single kilometer.
A 10K inside a half marathon or marathon block
This is where a 10K pays off most for the runners we write for. A 10K race or time trial in the middle of a training block is about as close to a half marathon effort as you can get without running one. It tells you whether the goal pace you picked still makes sense.
What your 10K pace says about a half or marathon
The table below uses the Riegel formula, T2 = T1 x (D2 / D1)^1.06, published by Peter Riegel in 1981. It assumes you have trained for the longer distance. For first-time half and marathon runners it is usually optimistic, especially for the marathon, so treat each number as a ceiling to build a goal under, not a promise.
| 10K time | Half marathon 21.1 km (13.1 mi) | Marathon 42.2 km (26.2 mi) |
|---|---|---|
| 40:00 | 1:28:15 | 3:04:00 |
| 45:00 | 1:39:17 | 3:27:01 |
| 50:00 | 1:50:19 | 3:50:01 |
| 55:00 | 2:01:21 | 4:13:01 |
| 1:00:00 | 2:12:23 | 4:36:01 |
| 1:05:00 | 2:23:25 | 4:59:01 |
| 1:10:00 | 2:34:27 | 5:22:01 |
So a 50:00 10K points to a half marathon near 1:50:00 and a marathon near 3:50 at best. The same formula runs the other way: a 25:00 5K points to about 52:07 for 10 km (5:13 /km, 8:23 /mi). To turn a half marathon goal into splits, use the half marathon pace chart. The race time predictor does this math for any distance you have raced.
Do not train at 10K pace on most days. Your easy runs should be well slower, at a pace where you can talk in full sentences. 10K pace belongs in one harder session a week at most, such as the reps in an interval training plan. For where that one session sits in the week, see this weekly 10k schedule.
Mistakes that make a 10K pace chart lie
The math in the chart is exact. These are the ways runners still get the wrong number out of it.
- Banking time in the first 2 km. It feels free and it is the most expensive time you will ever borrow.
- Trusting the live pace on your watch. GPS pace jumps under trees and between buildings. Use the 1 km lap split.
- Expecting your watch to read 10.00 km. Courses are measured along the shortest possible line, and almost nobody runs exactly that line. A watch reading 10.1 or 10.2 km (6.3 mi) at the finish is normal, so your watch pace will look a little faster than the chart.
- Not counting the water stop. Slowing to drink costs a few seconds. Take the cup on the move, or plan for it rather than panic about it.
- Choosing a goal five rows faster. Each row is a full minute. Move one or two rows at a time.

Where a 10K chart stops helping
A chart gives you one pace for one day. Training for a half or a marathon is 10 to 16 weeks of days, and your fitness moves under you. Run a faster 10K in week 6 and every pace in your plan is now too slow. Miss a week with a cold and the same paces are now too fast. A printed plan does not change when your week does.
That is the wall. Build your free plan for your race date. On the Coach plan, next week re-plans itself when you miss a run. You can build a half marathon training plan around your current 10K time below.
Free training plan
Build your free plan for your race date.
Pick your race and race date. Every week from today to race day is planned for you, with distances in km and miles.
General training guidance, not medical advice. Check with a doctor before increasing training if you have symptoms or a health condition.
The short version
Divide your 10K goal by 10 for your pace per km, multiply by 1.609 for per mile, and remember that each row in the chart is a full minute. Run the first 2 km on your number, check the clock at 5 km, hold to 8 km and race only the end.
If a half or marathon is booked, use a 10K every few weeks as a check on your goal pace, and build your free plan for your race date so the paces move with you.
Frequently asked questions
Pace is the time it takes to cover one kilometer or one mile, written as minutes and seconds. In a 10K, a pace of 6:00 /km (9:39 /mi) means each kilometer takes six minutes, so the 10 km (6.2 mi) takes 1:00:00. A lower number is faster.
You need to average faster than 4:00 per km, or 6:26 per mile, for the whole race. That is 1:36 per 400 m (0.25 mi) lap on a track, 20:00 at 5 km (3.1 mi), and a treadmill speed above 15.0 km/h (9.3 mph).
Start from a race you have run recently. If it was a 10K, use that row of the chart or one row faster. If it was a 5K, multiply your 5K time by about 2.085, the Riegel conversion, and then divide by 10 for pace per km. Then check the pace in a training run of 3 to 5 km (2 to 3 mi) at goal pace: if you cannot hold it comfortably hard, pick a slower row.
Free training plan
Build your free plan for your race date.
On the Coach plan, next week re-plans itself when you miss a run.
Share article
About the author
More running training guides
Pacing and race day · 10 min
How Long Does It Take to Run a Mile? Times by Age and Pace
Most people run a mile in 9 to 13 minutes at an easy pace and 6 to 8 minutes at race effort. See mile times by age, pace per km and how to get faster.
Pacing and race day · 9 min
How Long to Run a 10K: Finish Times, Miles and Training
A 10k run is 10 km (6.21 mi) and takes about 60 minutes at 6:00 /km (9:39 /mi). See finish times at every pace, how long to train for one and how to pace your first race.
Pacing and race day · 10 min
5K Running Pace Chart: Every Time From 15 to 45 Minutes
A 5K running pace chart for every finish time from 15:00 to 45:00: pace per km and per mile, 400 m lap times, treadmill speeds, and what your 5K says about a half or marathon.
Pacing and race day · 10 min
Average 5K Time by Age for Men and Women (20 to 80)
The average 5K time by age is about 22:41 for men and 27:19 for women in their 20s, slowing by about a minute every five years after 35. Here are the age tables, the race field median of 34:37, and how to find your own time.
Pacing and race day · 10 min
Running Pace Conversion Chart: Km, Mile and Treadmill
Convert any running pace between minutes per km and minutes per mile, and treadmill mph or km/h into pace, with marathon and half marathon finish times in the same charts.
Pacing and race day · 11 min
What Is a Negative Split in Running? Splits for Every Goal
A negative split means you run the second half of a race faster than the first. You earn it by starting 5 to 10 seconds per km slower than goal pace, not by sprinting the end. Here is how big it should be for each race distance, the marathon halves for common goals, and the two sessions that train it.