
Average Marathon Time: 4:34 in the US, by Age and Gender
Raceblock team Updated November 14, 2026 12 min read
Free marathon plan for your race date
Free marathon plan for your race date
Build my free planIn this article
The average marathon time in the US was 4 hours 34 minutes in 2024, a pace of about 6:30 /km (10:27 /mi) over 42.2 km (26.2 mi). Men averaged 4:24 and women 4:51, according to RunRepeat's State of US Marathons 2025, which covers about 97% of US marathon results with elite runners removed.
That number describes the field, not you. It mixes first-timers who walk the last 10 km (6.2 mi) with club runners who have raced for years, and it tells you nothing about what your own training can carry. The more useful number is your own estimate, worked out from a recent race and the weeks you have actually run.
What is the average marathon time?
The average US marathon finish time was 4:34 in 2024, down from 4:39 in 2019. RunRepeat calls it the first time in decades that marathon runners have got faster on average. At 4:34 you cover each kilometer in about 6:30 and each mile in about 10:27, spread over the exact marathon distance of 42.195 km (26.2 mi), which most watches read a little long.
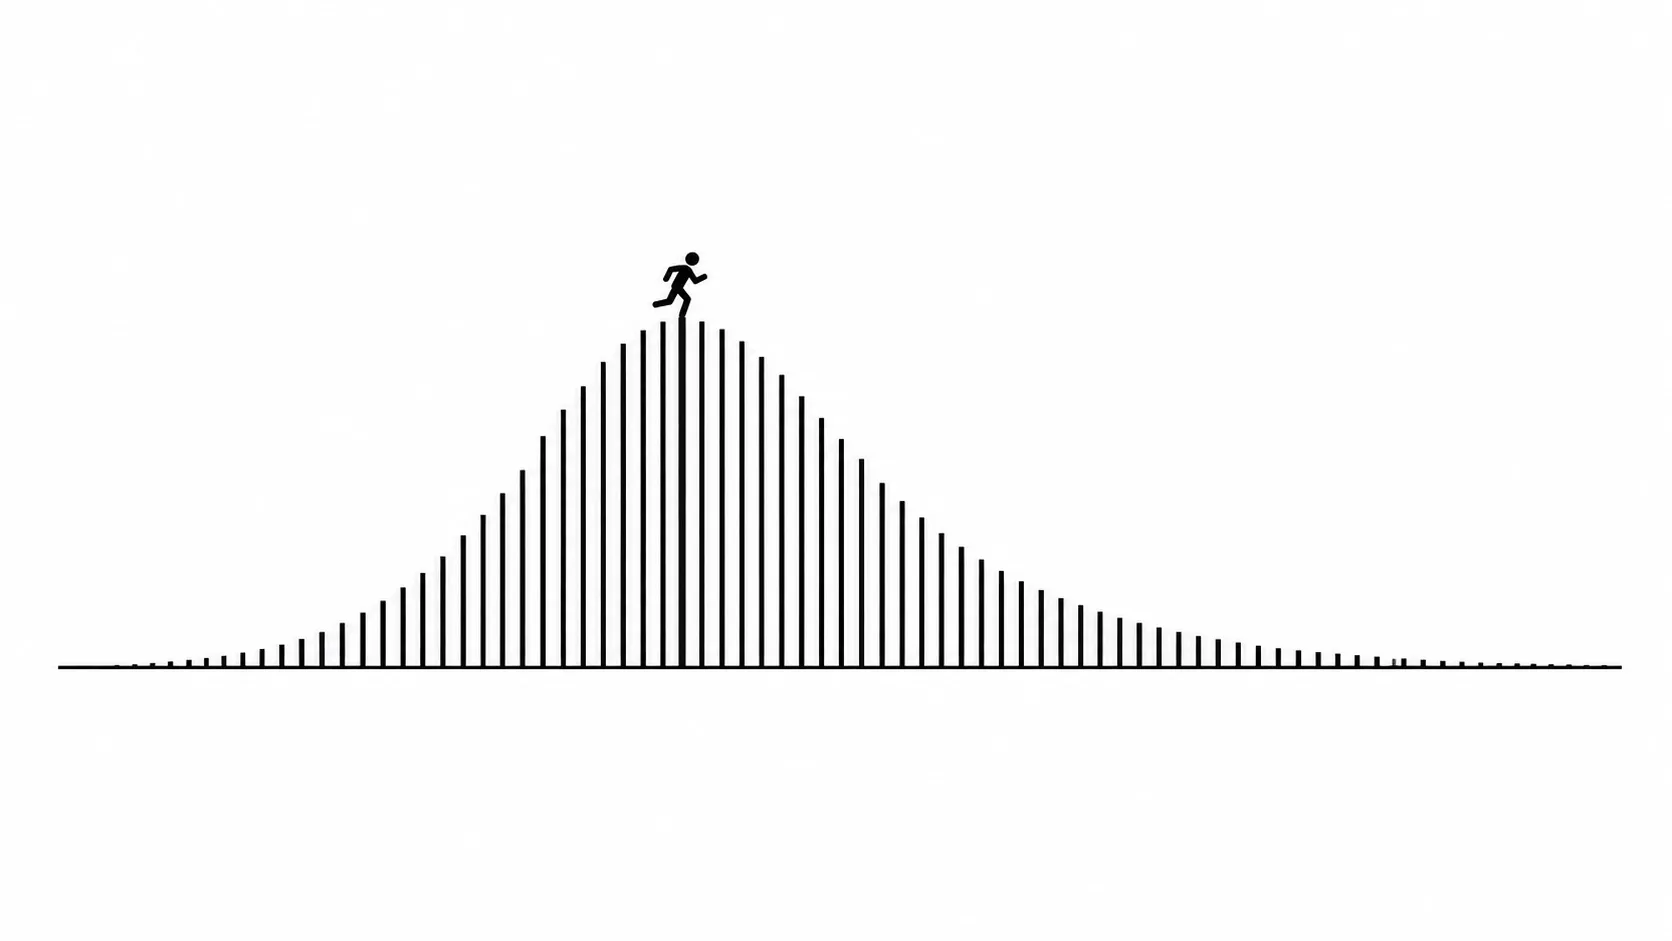
Finish times do not spread evenly. Most finishers bunch around the middle, and a long tail stretches out on the slow side, where runners walk large parts of the course. That tail pulls the average later than the time a typical mid-pack runner sees on the clock, so treat 4:34 as a rough center, not a line between good and bad.
| Year | Average US marathon time | Pace per km | Pace per mile |
|---|---|---|---|
| 2019 | 4:39 | 6:37 /km | 10:38 /mi |
| 2024 | 4:34 | 6:30 /km | 10:27 /mi |
Average marathon time for men and women
In 2024, men averaged 4:24 and women 4:51 in US marathons. Both groups got a little faster than in 2019, men by 2.2% and women by 1.1%.
| Group | Average time 2019 | Average time 2024 | 2024 pace per km | 2024 pace per mile |
|---|---|---|---|---|
| Men | 4:28 | 4:24 | 6:15 /km | 10:04 /mi |
| Women | 4:54 | 4:51 | 6:54 /km | 11:06 /mi |
| Everyone | 4:39 | 4:34 | 6:30 /km | 10:27 /mi |
The 27-minute gap between the two averages is real, but it is smaller than the spread inside each group. Training, pacing and the course can move one runner's time by more than that gap, so compare yourself with runners on similar training, not with your gender's average.
Average marathon time by age
The 18 to 24 group averaged the fastest US marathon time in 2024, 4:19. Every older group averaged a little slower, with the biggest steps after 55.

| Age group | Average time 2019 | Average time 2024 | 2024 pace per km | 2024 pace per mile |
|---|---|---|---|---|
| 18 to 24 | 4:21 | 4:19 | 6:08 /km | 9:53 /mi |
| 25 to 34 | 4:33 | 4:27 | 6:20 /km | 10:11 /mi |
| 35 to 44 | 4:35 | 4:29 | 6:23 /km | 10:16 /mi |
| 45 to 54 | 4:42 | 4:38 | 6:35 /km | 10:36 /mi |
| 55 to 64 | 4:58 | 4:58 | 7:04 /km | 11:22 /mi |
| 65 and over | 5:39 | 5:35 | 7:56 /km | 12:47 /mi |
Look at how close the groups from 25 to 54 sit: 4:27 to 4:38, an 11-minute range across three decades of age. Training, pacing and the course move a single runner's time more than that. If you are over 45 and wondering whether it is too late to run a good marathon, the data says the average runner in your age group is only minutes behind the 30-year-olds.
What is a good marathon time?
A good marathon time is one that your recent racing and training support, run at an even effort from the start. For a first marathon, finishing in good shape is the goal. After that, a good time is a few minutes faster than your last one, or a time you predicted and then ran.
Benchmarks still help you place a goal. Here is how common goal times compare with the 2024 US average.
| Finish time | Pace per km | Pace per mile | Compared with the 4:34 average |
|---|---|---|---|
| 3:00 | 4:16 /km | 6:52 /mi | 94 minutes faster |
| 3:30 | 4:59 /km | 8:01 /mi | 64 minutes faster |
| 4:00 | 5:41 /km | 9:09 /mi | 34 minutes faster |
| 4:30 | 6:24 /km | 10:18 /mi | 4 minutes faster |
| 5:00 | 7:07 /km | 11:27 /mi | 26 minutes slower |
| 5:30 | 7:49 /km | 12:35 /mi | 56 minutes slower |
| 6:00 | 8:32 /km | 13:44 /mi | 86 minutes slower |
A 4:00 finish is about half an hour faster than the average, which is why it is such a common goal. If that is your target, the sub-4-hour marathon training plan shows the weekly build around it. For the other common goal times, the full chart below shows the pace each one needs.
Marathon pace chart
| Goal time | Pace per km | Pace per mile | 5K 5 km (3.1 mi) | 10K 10 km (6.2 mi) | Halfway 21.1 km (13.1 mi) | 30K 30 km (18.6 mi) |
|---|---|---|---|---|---|---|
| 2:30:00 | 3:33 /km | 5:43 /mi | 17:46 | 35:33 | 1:15:00 | 1:46:39 |
| 2:35:00 | 3:40 /km | 5:55 /mi | 18:22 | 36:44 | 1:17:30 | 1:50:12 |
| 2:40:00 | 3:48 /km | 6:06 /mi | 18:58 | 37:55 | 1:20:00 | 1:53:45 |
| 2:45:00 | 3:55 /km | 6:18 /mi | 19:33 | 39:06 | 1:22:30 | 1:57:19 |
| 2:50:00 | 4:02 /km | 6:29 /mi | 20:09 | 40:17 | 1:25:00 | 2:00:52 |
| 2:55:00 | 4:09 /km | 6:40 /mi | 20:44 | 41:28 | 1:27:30 | 2:04:25 |
| 3:00:00 | 4:16 /km | 6:52 /mi | 21:20 | 42:40 | 1:30:00 | 2:07:59 |
| 3:05:00 | 4:23 /km | 7:03 /mi | 21:55 | 43:51 | 1:32:30 | 2:11:32 |
| 3:10:00 | 4:30 /km | 7:15 /mi | 22:31 | 45:02 | 1:35:00 | 2:15:05 |
| 3:15:00 | 4:37 /km | 7:26 /mi | 23:06 | 46:13 | 1:37:30 | 2:18:39 |
| 3:20:00 | 4:44 /km | 7:38 /mi | 23:42 | 47:24 | 1:40:00 | 2:22:12 |
| 3:25:00 | 4:52 /km | 7:49 /mi | 24:18 | 48:35 | 1:42:30 | 2:25:45 |
| 3:30:00 | 4:59 /km | 8:01 /mi | 24:53 | 49:46 | 1:45:00 | 2:29:18 |
| 3:35:00 | 5:06 /km | 8:12 /mi | 25:29 | 50:57 | 1:47:30 | 2:32:52 |
| 3:40:00 | 5:13 /km | 8:23 /mi | 26:04 | 52:08 | 1:50:00 | 2:36:25 |
| 3:45:00 | 5:20 /km | 8:35 /mi | 26:40 | 53:19 | 1:52:30 | 2:39:58 |
| 3:50:00 | 5:27 /km | 8:46 /mi | 27:15 | 54:31 | 1:55:00 | 2:43:32 |
| 3:55:00 | 5:34 /km | 8:58 /mi | 27:51 | 55:42 | 1:57:30 | 2:47:05 |
| 4:00:00 | 5:41 /km | 9:09 /mi | 28:26 | 56:53 | 2:00:00 | 2:50:38 |
| 4:05:00 | 5:48 /km | 9:21 /mi | 29:02 | 58:04 | 2:02:30 | 2:54:11 |
| 4:10:00 | 5:55 /km | 9:32 /mi | 29:37 | 59:15 | 2:05:00 | 2:57:45 |
| 4:15:00 | 6:03 /km | 9:44 /mi | 30:13 | 1:00:26 | 2:07:30 | 3:01:18 |
| 4:20:00 | 6:10 /km | 9:55 /mi | 30:49 | 1:01:37 | 2:10:00 | 3:04:51 |
| 4:25:00 | 6:17 /km | 10:06 /mi | 31:24 | 1:02:48 | 2:12:30 | 3:08:25 |
| 4:30:00 | 6:24 /km | 10:18 /mi | 32:00 | 1:03:59 | 2:15:00 | 3:11:58 |
| 4:35:00 | 6:31 /km | 10:29 /mi | 32:35 | 1:05:10 | 2:17:30 | 3:15:31 |
| 4:40:00 | 6:38 /km | 10:41 /mi | 33:11 | 1:06:22 | 2:20:00 | 3:19:05 |
| 4:45:00 | 6:45 /km | 10:52 /mi | 33:46 | 1:07:33 | 2:22:30 | 3:22:38 |
| 4:50:00 | 6:52 /km | 11:04 /mi | 34:22 | 1:08:44 | 2:25:00 | 3:26:11 |
| 4:55:00 | 6:59 /km | 11:15 /mi | 34:57 | 1:09:55 | 2:27:30 | 3:29:44 |
| 5:00:00 | 7:07 /km | 11:27 /mi | 35:33 | 1:11:06 | 2:30:00 | 3:33:18 |
| 5:05:00 | 7:14 /km | 11:38 /mi | 36:09 | 1:12:17 | 2:32:30 | 3:36:51 |
| 5:10:00 | 7:21 /km | 11:49 /mi | 36:44 | 1:13:28 | 2:35:00 | 3:40:24 |
| 5:15:00 | 7:28 /km | 12:01 /mi | 37:20 | 1:14:39 | 2:37:30 | 3:43:58 |
| 5:20:00 | 7:35 /km | 12:12 /mi | 37:55 | 1:15:50 | 2:40:00 | 3:47:31 |
| 5:25:00 | 7:42 /km | 12:24 /mi | 38:31 | 1:17:01 | 2:42:30 | 3:51:04 |
| 5:30:00 | 7:49 /km | 12:35 /mi | 39:06 | 1:18:12 | 2:45:00 | 3:54:37 |
| 5:35:00 | 7:56 /km | 12:47 /mi | 39:42 | 1:19:24 | 2:47:30 | 3:58:11 |
| 5:40:00 | 8:03 /km | 12:58 /mi | 40:17 | 1:20:35 | 2:50:00 | 4:01:44 |
| 5:45:00 | 8:11 /km | 13:10 /mi | 40:53 | 1:21:46 | 2:52:30 | 4:05:17 |
| 5:50:00 | 8:18 /km | 13:21 /mi | 41:28 | 1:22:57 | 2:55:00 | 4:08:51 |
| 5:55:00 | 8:25 /km | 13:32 /mi | 42:04 | 1:24:08 | 2:57:30 | 4:12:24 |
| 6:00:00 | 8:32 /km | 13:44 /mi | 42:40 | 1:25:19 | 3:00:00 | 4:15:57 |
| 6:05:00 | 8:39 /km | 13:55 /mi | 43:15 | 1:26:30 | 3:02:30 | 4:19:31 |
| 6:10:00 | 8:46 /km | 14:07 /mi | 43:51 | 1:27:41 | 3:05:00 | 4:23:04 |
| 6:15:00 | 8:53 /km | 14:18 /mi | 44:26 | 1:28:52 | 3:07:30 | 4:26:37 |
| 6:20:00 | 9:00 /km | 14:30 /mi | 45:02 | 1:30:03 | 3:10:00 | 4:30:10 |
| 6:25:00 | 9:07 /km | 14:41 /mi | 45:37 | 1:31:15 | 3:12:30 | 4:33:44 |
| 6:30:00 | 9:15 /km | 14:52 /mi | 46:13 | 1:32:26 | 3:15:00 | 4:37:17 |
| 6:35:00 | 9:22 /km | 15:04 /mi | 46:48 | 1:33:37 | 3:17:30 | 4:40:50 |
| 6:40:00 | 9:29 /km | 15:15 /mi | 47:24 | 1:34:48 | 3:20:00 | 4:44:24 |
| 6:45:00 | 9:36 /km | 15:27 /mi | 47:59 | 1:35:59 | 3:22:30 | 4:47:57 |
| 6:50:00 | 9:43 /km | 15:38 /mi | 48:35 | 1:37:10 | 3:25:00 | 4:51:30 |
| 6:55:00 | 9:50 /km | 15:50 /mi | 49:11 | 1:38:21 | 3:27:30 | 4:55:04 |
| 7:00:00 | 9:57 /km | 16:01 /mi | 49:46 | 1:39:32 | 3:30:00 | 4:58:37 |
For a printable pace band and split calculator, see the marathon pace chart.
Average marathon time for beginners
There is no reliable published average for first-time marathoners alone, so be wary of any single number you see quoted. What the data does show is that the whole field, first-timers included, averaged 4:34 in 2024. A first marathon is also where most runners learn to pace 42.2 km (26.2 mi), and many walk part of the last 10 km (6.2 mi). Expect your first time to say more about your pacing than your fitness.
Use the table below to find where you fit before you choose a goal.
| Your situation | What to aim for | Where to start |
|---|---|---|
| First marathon, running 3 times a week | Finish strong; set a time range, not a single number | The 16-week marathon training plan |
| First marathon, with a recent half marathon time | A goal range from your half time | The race predictor below |
| Second marathon, first one faded late | The same time, run with even splits | Pace the first half at the slower end of your range |
| Experienced, training 4 to 5 days a week | A goal from a recent 10 km (6.2 mi) or half | The marathon training plan guide |
Predict your own marathon time
A recent race is the best starting point for your own marathon estimate. A 5 km (3.1 mi), 10 km (6.2 mi) or half marathon time run in the last two months tells you far more than any average.

Enter a recent race below. The result is a starting estimate that assumes you have done the long runs and weekly distance a marathon needs; it is not a promised finish time.
Race time predictor: enter a recent result
Estimates from a 25:00 5K
| Race | Riegel | VDOT-style | Estimated range | Pace range |
|---|---|---|---|---|
| 5K 5 km (3.1 mi) | 25:00 | 25:00 | 25:00 | 5:00 /km (8:03 /mi) |
| 10K 10 km (6.2 mi) | 52:07 | 51:53 | 51:53 to 52:07 | 5:11 to 5:13 /km (8:21 to 8:23 /mi) |
| Half marathon 21.1 km (13.1 mi) | 1:55:00 | 1:55:04 | 1:55:00 to 1:55:04 | 5:27 /km (8:46 to 8:47 /mi) |
| Marathon 42.2 km (26.2 mi) | 3:59:47 | 3:57:55 | 3:57:55 to 3:59:47 | 5:38 to 5:41 /km (9:04 to 9:09 /mi) |
Predictions for the marathon run optimistic for runners without marathon-specific training. Treat the faster end as a ceiling, not a target.
Training paces from your 5K equivalent (25:00)
- Easy
- 6:15 to 6:45 /km (10:04 to 10:52 /mi)
- Steady
- 5:30 to 5:45 /km (8:51 to 9:15 /mi)
- Tempo
- 5:12 to 5:24 /km (8:22 to 8:41 /mi)
- Intervals
- 4:54 to 5:06 /km (7:53 to 8:12 /mi)
Paces are general training guidance, not medical advice. Check with a doctor before starting a new training plan, and stop if you feel pain, chest pain or dizziness.
Predicted times from 5K results
| 5K time 5 km (3.1 mi) | 10K 10 km (6.2 mi) | Half marathon 21.1 km (13.1 mi) | Marathon 42.2 km (26.2 mi) |
|---|---|---|---|
| 18:00 | 37:20 to 37:32 | 1:22:33 to 1:22:48 | 2:52:25 to 2:52:38 |
| 19:00 | 39:24 to 39:37 | 1:27:11 to 1:27:24 | 3:01:52 to 3:02:14 |
| 20:00 | 41:28 to 41:42 | 1:31:50 to 1:32:00 | 3:11:17 to 3:11:49 |
| 21:00 | 43:32 to 43:47 | 1:36:28 to 1:36:36 | 3:20:41 to 3:21:25 |
| 22:00 | 45:37 to 45:52 | 1:41:07 to 1:41:12 | 3:30:03 to 3:31:00 |
| 23:00 | 47:42 to 47:57 | 1:45:46 to 1:45:48 | 3:39:22 to 3:40:36 |
| 24:00 | 49:48 to 50:02 | 1:50:24 to 1:50:25 | 3:48:40 to 3:50:11 |
| 25:00 | 51:53 to 52:07 | 1:55:00 to 1:55:04 | 3:57:55 to 3:59:47 |
| 26:00 | 53:59 to 54:12 | 1:59:36 to 1:59:42 | 4:07:08 to 4:09:22 |
| 27:00 | 56:05 to 56:18 | 2:04:12 to 2:04:20 | 4:16:19 to 4:18:58 |
| 28:00 | 58:11 to 58:23 | 2:08:48 to 2:08:57 | 4:25:28 to 4:28:33 |
| 29:00 | 1:00:17 to 1:00:28 | 2:13:24 to 2:13:34 | 4:34:35 to 4:38:09 |
| 30:00 | 1:02:23 to 1:02:33 | 2:18:00 to 2:18:10 | 4:43:39 to 4:47:44 |
| 31:00 | 1:04:29 to 1:04:38 | 2:22:36 to 2:22:45 | 4:52:41 to 4:57:19 |
| 32:00 | 1:06:35 to 1:06:43 | 2:27:12 to 2:27:20 | 5:01:42 to 5:06:55 |
| 33:00 | 1:08:41 to 1:08:48 | 2:31:48 to 2:31:53 | 5:10:40 to 5:16:30 |
| 34:00 | 1:10:47 to 1:10:53 | 2:36:24 to 2:36:26 | 5:19:36 to 5:26:06 |
| 35:00 | 1:12:53 to 1:12:58 | 2:40:59 to 2:41:00 | 5:28:30 to 5:35:41 |
| 36:00 | 1:14:59 to 1:15:03 | 2:45:30 to 2:45:36 | 5:37:22 to 5:45:17 |
| 37:00 | 1:17:05 to 1:17:09 | 2:50:01 to 2:50:12 | 5:46:13 to 5:54:52 |
| 38:00 | 1:19:11 to 1:19:14 | 2:54:30 to 2:54:48 | 5:55:01 to 6:04:28 |
| 39:00 | 1:21:17 to 1:21:19 | 2:58:59 to 2:59:24 | 6:03:48 to 6:14:03 |
| 40:00 | 1:23:22 to 1:23:24 | 3:03:27 to 3:04:00 | 6:12:33 to 6:23:39 |
Sources
- Peter Riegel (Wikipedia): race time prediction formula Checked Oct 12, 2026
- Jack Daniels (Wikipedia): VDOT and training intensities Checked Oct 12, 2026
Predictions run optimistic if your longest run is still short or your weekly distance is low, because a 5 km (3.1 mi) time says nothing about the last 12 km (7.5 mi) of a marathon. The race time predictor guide explains how to adjust for that.
How to estimate your own marathon time
- Get a recent race time
Race or time-trial 5 km (3.1 mi), 10 km (6.2 mi) or a half marathon within the last 8 weeks, on a flat course and at a hard but controlled effort.
- Run it through the predictor
Enter that time in the race predictor. The marathon result is your starting estimate.
- Check it against your training
If your longest run is under 26 km (16 mi) or you run fewer than three times a week, add time to the estimate rather than trusting it as it is.
- Adjust for the course and the day
Hills, heat and wind all slow you. Add a few minutes for a hilly course or a warm forecast.
- Pick a range, not one number
Set a goal range of 10 to 15 minutes. Start at the slower end and only speed up after halfway if you feel good. That is a negative split in practice: a controlled first half that leaves room to finish stronger.
Why the average marathon runner slows late
When a marathon goes wrong, it usually shows after 30 km (18.6 mi). A runner who starts faster than their training supports tends to pay for it late, and that fade is part of what stretches the slow tail of finish times.
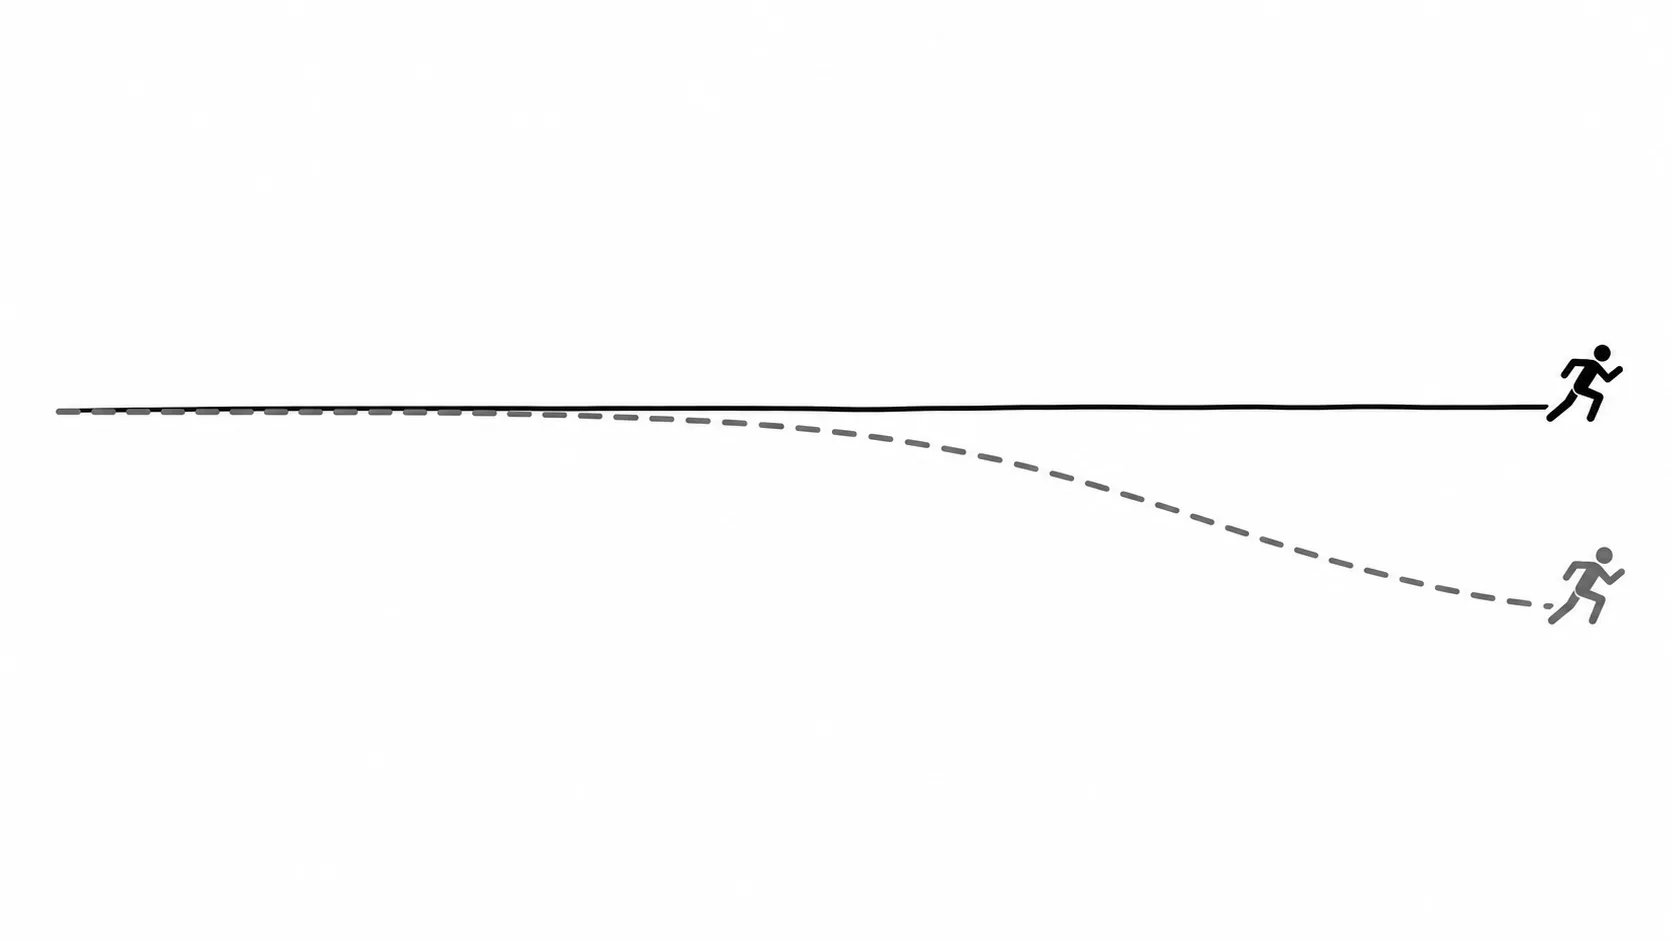
A common rule of thumb is the 10-10-10 approach: run the first 16.1 km (10 mi) controlled, the next 16.1 km (10 mi) at goal pace, and race the last 10 km (6.2 mi) with whatever you have left. It keeps the first hour honest, which is where most pacing mistakes start.
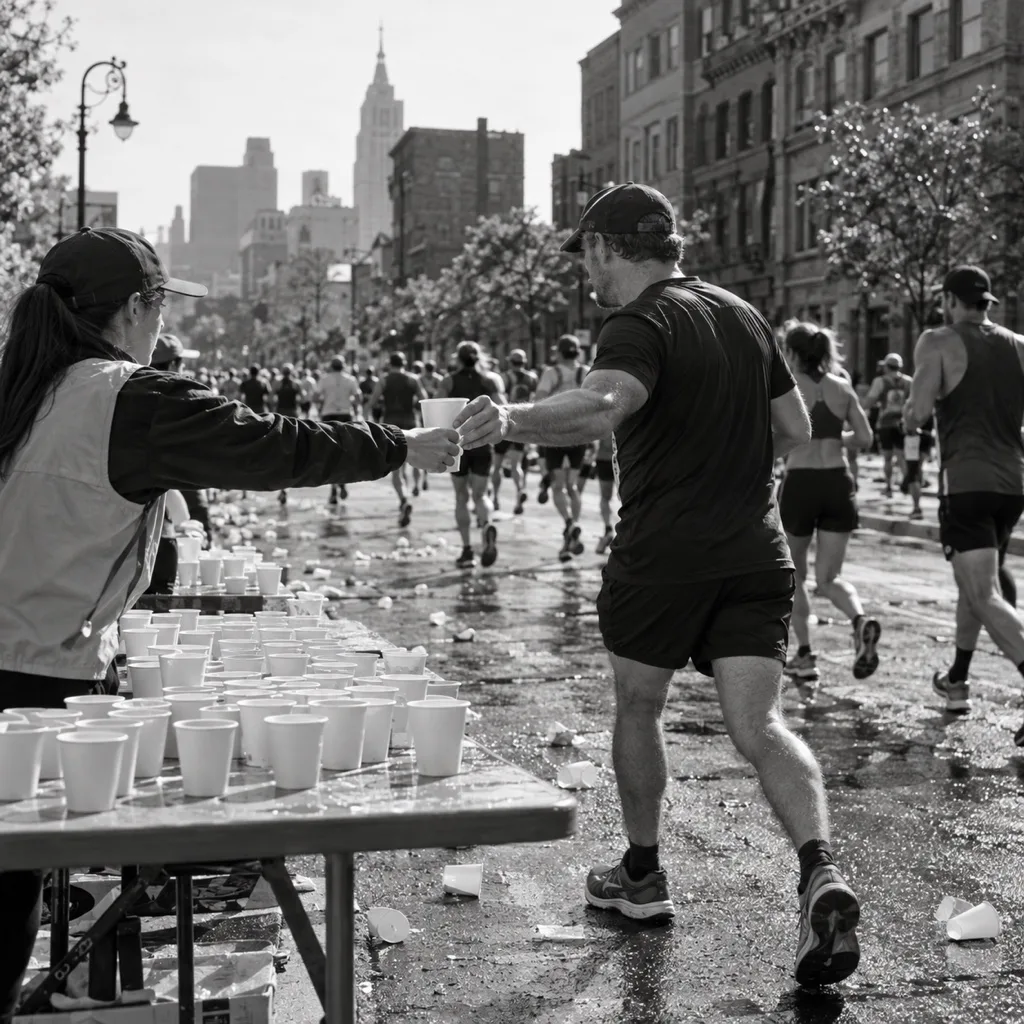
Taper properly, too. Arriving tired costs more time than one extra long run could ever give back; the marathon taper guide covers the last three weeks.
Training paces behind a typical finish
Your race time comes from your training, so the paces you run every week matter more than the goal. Here are training paces for a sample 16-week, four-day plan built around a 28:00 time over 5 km (3.1 mi), which predicts a finish close to the average.
Training paces per km and per mile
- Easy
- 7:00 to 7:34 /km (11:16 to 12:10 /mi)
- Steady
- 6:10 to 6:26 /km (9:55 to 10:22 /mi)
- Tempo
- 5:49 to 6:03 /km (9:22 to 9:44 /mi)
- Intervals
- 5:29 to 5:43 /km (8:50 to 9:12 /mi)
- Long
- 7:00 to 7:34 /km (11:16 to 12:10 /mi)
- Goal
- 6:16 to 6:30 /km (10:06 to 10:27 /mi)
| Recent 5k | Easy conversational | Steady comfortably steady | Tempo comfortably hard | Intervals controlled hard efforts | Race effort controlled |
|---|---|---|---|---|---|
| 20:00 | 5:00 to 5:24 /km (8:03 to 8:41 /mi) | 4:24 to 4:36 /km (7:05 to 7:24 /mi) | 4:10 to 4:19 /km (6:42 to 6:57 /mi) | 3:55 to 4:05 /km (6:19 to 6:34 /mi) | 4:29 to 4:38 /km (7:13 to 7:28 /mi) |
| 23:00 | 5:45 to 6:13 /km (9:15 to 10:00 /mi) | 5:04 to 5:17 /km (8:09 to 8:31 /mi) | 4:47 to 4:58 /km (7:42 to 8:00 /mi) | 4:30 to 4:42 /km (7:15 to 7:33 /mi) | 5:09 to 5:20 /km (8:17 to 8:35 /mi) |
| 26:00 | 6:30 to 7:01 /km (10:28 to 11:18 /mi) | 5:43 to 5:59 /km (9:12 to 9:37 /mi) | 5:24 to 5:37 /km (8:42 to 9:02 /mi) | 5:06 to 5:18 /km (8:12 to 8:32 /mi) | 5:49 to 6:02 /km (9:22 to 9:42 /mi) |
| 28:00pace used in the table | 7:00 to 7:34 /km (11:16 to 12:10 /mi) | 6:10 to 6:26 /km (9:55 to 10:22 /mi) | 5:49 to 6:03 /km (9:22 to 9:44 /mi) | 5:29 to 5:43 /km (8:50 to 9:12 /mi) | 6:16 to 6:30 /km (10:06 to 10:27 /mi) |
| 29:00 | 7:15 to 7:50 /km (11:40 to 12:36 /mi) | 6:23 to 6:40 /km (10:16 to 10:44 /mi) | 6:02 to 6:16 /km (9:42 to 10:05 /mi) | 5:41 to 5:55 /km (9:09 to 9:31 /mi) | 6:30 to 6:44 /km (10:27 to 10:50 /mi) |
| 32:00 | 8:00 to 8:38 /km (12:52 to 13:54 /mi) | 7:02 to 7:22 /km (11:20 to 11:51 /mi) | 6:39 to 6:55 /km (10:43 to 11:07 /mi) | 6:16 to 6:32 /km (10:06 to 10:30 /mi) | 7:10 to 7:25 /km (11:32 to 11:57 /mi) |
| 35:00 | 8:45 to 9:27 /km (14:05 to 15:12 /mi) | 7:42 to 8:03 /km (12:24 to 12:57 /mi) | 7:17 to 7:34 /km (11:43 to 12:10 /mi) | 6:52 to 7:08 /km (11:02 to 11:29 /mi) | 7:50 to 8:07 /km (12:37 to 13:04 /mi) |
General training guidance, not medical advice. Check with a doctor before increasing training if you have symptoms or a health condition.
General training guidance, not medical advice. Check with a doctor before increasing training if you have symptoms or a health condition.
Most of those weekly runs should be easy, at a pace where you can talk in full sentences. The long run builds the endurance that keeps your pace from fading after 30 km (18.6 mi).
When the plan stops matching your weeks
Everything above works on paper: pick a goal from a recent race, train at the right paces, pace the race evenly. The trouble starts in week 9, when a cold takes five days or a work trip lands on two long runs. A printed plan doesn't move when your week does. You are left guessing whether to repeat a week, skip ahead or quietly lower the goal, and the estimate you started with no longer matches the running you did.
The fix is a plan built from your race date and the runs you actually logged. Build your free plan for your race date. On the Coach plan, next week re-plans itself when you miss a run.
Free training plan
Build your free plan for your race date.
Pick your race and race date. Every week from today to race day is planned for you, with distances in km and miles.
If you already missed a long run, read what to do after a missed long run before you try to make it up. To see how Free and Coach differ, check the plan options.
Compare marathon plans by length
If you are still choosing how long to train, compare the sample plans side by side. Each one builds the long run and weekly distance differently.
| Plan | Weeks | Runs a week | Peak week | Longest run | Level |
|---|---|---|---|---|---|
| 16-week marathon plan for beginners | 16 | 4 | 68.1 km (42.3 mi) | 29 km (18 mi) | Beginner |
| Sub-4 marathon plan | 16 | 5 | 80.6 km (50.1 mi) | 29.9 km (18.6 mi) | Intermediate |
Mistakes that cost marathon time
- Choosing a goal from the average. 4:34 is the field's number. Your recent race and your training are yours.
- Starting at goal pace plus excitement. Running the first 5 km (3.1 mi) 10 seconds per km (16 seconds per mile) too fast can cost you more after 30 km (18.6 mi) than it gained.
- Skipping fuel early. Waiting until you feel empty is too late to catch up.
- Racing the training runs. Easy runs at race effort leave you tired for the long run.
- Pushing through pain. Sharp pain, chest pain, dizziness or swelling means stop and see a doctor or physio.
The average marathon time in the US is 4:34, with men at 4:24 and women at 4:51, and the age groups from 25 to 54 sit within 11 minutes of each other. It is a useful landmark, not a target. Your own marathon time comes from a recent race, the long runs you complete and how evenly you pace the first half.
Pick a goal range from your recent race, train mostly easy, and start slower than you think you need to. When your weeks shift, build your free plan for your race date: on the Coach plan, next week re-plans itself when you miss a run.
Distances follow the official marathon of 42.195 km (26.219 mi) from World Athletics.
Frequently asked questions
Use your age group's average as a landmark. In 2024 US marathons, the averages were 4:19 for 18 to 24, 4:27 for 25 to 34, 4:29 for 35 to 44, 4:38 for 45 to 54, 4:58 for 55 to 64 and 5:35 for 65 and over. Finishing near or ahead of your group's average is a respectable result.
Age grading compares your time with the best time for your age and sex, using published age-grading factors. Enter your age, sex and finish time in an age-grading calculator based on those tables. The result is a percentage you can compare across ages.
Yes. A 4:00 marathon is 34 minutes faster than the 2024 US average of 4:34, at about 5:41 /km (9:09 /mi). It needs consistent training and even pacing for most runners.
Yes. A 3:30 marathon is 64 minutes faster than the US average, at about 4:59 /km (8:01 /mi). It needs a strong training base and even pacing.
In the 2024 US data, the 18 to 24 group averaged the fastest time, 4:19, and each older group averaged a little slower. The groups from 25 to 54 were within 11 minutes of each other, so many runners keep improving well into their 40s if their training improves.
No. 7:00 /km (11:16 /mi) adds up to about 4:55 for a marathon, close to the 2024 US women's average of 4:51. It is a common and steady marathon pace.
A 6:00 marathon needs about 8:32 /km (13:44 /mi) for the whole distance, which is faster than most people walk. Many runners reach 6:00 with planned run and walk intervals. Check your race's cutoff time before you enter.
It is a pacing rule of thumb: run the first 16.1 km (10 mi) controlled, the next 16.1 km (10 mi) at goal pace and the last 10 km (6.2 mi) as hard as you can hold. It helps you avoid starting too fast.
Free training plan
Build your free plan for your race date.
On the Coach plan, next week re-plans itself when you miss a run.
Share article
About the author
More running training guides
Pacing and race day · 11 min
10K Running Pace Chart: Every Time From 35 to 75 Minutes
A 10K running pace chart for every finish time from 35:00 to 1:15:00: pace per km and per mile, 5 km halfway splits, 400 m laps, treadmill speeds, and what your 10K says about a half or marathon.
Pacing and race day · 10 min
How Long Does It Take to Run a Mile? Times by Age and Pace
Most people run a mile in 9 to 13 minutes at an easy pace and 6 to 8 minutes at race effort. See mile times by age, pace per km and how to get faster.
Pacing and race day · 9 min
How Long to Run a 10K: Finish Times, Miles and Training
A 10k run is 10 km (6.21 mi) and takes about 60 minutes at 6:00 /km (9:39 /mi). See finish times at every pace, how long to train for one and how to pace your first race.
Pacing and race day · 10 min
5K Running Pace Chart: Every Time From 15 to 45 Minutes
A 5K running pace chart for every finish time from 15:00 to 45:00: pace per km and per mile, 400 m lap times, treadmill speeds, and what your 5K says about a half or marathon.
Pacing and race day · 10 min
Average 5K Time by Age for Men and Women (20 to 80)
The average 5K time by age is about 22:41 for men and 27:19 for women in their 20s, slowing by about a minute every five years after 35. Here are the age tables, the race field median of 34:37, and how to find your own time.
Pacing and race day · 10 min
Running Pace Conversion Chart: Km, Mile and Treadmill
Convert any running pace between minutes per km and minutes per mile, and treadmill mph or km/h into pace, with marathon and half marathon finish times in the same charts.